Solutions

Platform

Six Products, One Study

Novasyne builds software for clinical and translational research that works with physiological data as it actually arrives: raw amplifier files, wrist recorder exports, imaging series and wide biomarker tables, starting from the literature that justifies the study in the first place. Research Workbench turns a research question into an evidence-backed foundation. STUDYPRO runs the trial. The four workbenches take the recordings that trial collects and turn them into results.

Each product runs in the browser, installs in hours rather than months, and exports in the open formats your statisticians already use.

Principles

Built For Research

Nothing is hidden behind a summary. Every inference the software makes is visible and can be overridden, every preprocessing step is recorded and travels with the file on export, and every automated interpretation names the literature it drew on.

Where a method does not fit the data, the software says so rather than returning a number that looks plausible. Repeated measures are flagged. Multiple testing is corrected. Import problems are reported, never quietly skipped.

Clinical Trial Management

STUDYPRO

A complete clinical trial management system built for academic institutions, hospitals and investigator initiated research. Studies, subjects, visits, consent, adverse events, budgets and documents live in one place, alongside the physiological recordings the trial collects. Where legacy systems treat high frequency data as an attachment, STUDYPRO stores EEG, wearable and imaging recordings as study data in their own right, ready to visualize and analyze without leaving the platform. Start a study from a template, or import one you already run in REDCap.

  • Guided study creation with interventional, observational, registry, case control and sensory templates
  • Import an existing REDCap project: its data dictionary is read, its fields are mapped, and the import is previewed and reported before a single record is written
  • Subject roster with demographics, cohort allocation, consent versioning and concomitant medication
  • EEG, wearable and imaging recordings held as study data and visualized in place, with one packet that exports every recording, document and table together
  • Every observation the study has collected on one timeline, with a calendar of collection
  • Dashboards for enrollment, recording compliance, adverse events and budget burn, with a spend forecast drawn from the ledger
  • Cohort comparison with t tests, ANOVA, Mann-Whitney U and Kruskal-Wallis, with effect sizes
  • Retrieval augmented AI reporting over your own protocols and literature, every claim carrying its citation, and protocol benchmarking against comparable completed trials on ClinicalTrials.gov
  • Right to erasure in one action: releasing a subject clears every identifying field and records who did it and when
  • An audit trail that outlives the study it describes, MedDRA coded adverse events and GCP aligned workflows
Watch the demo Download the user guide User guide, PDF, 57 pages, 13 MB
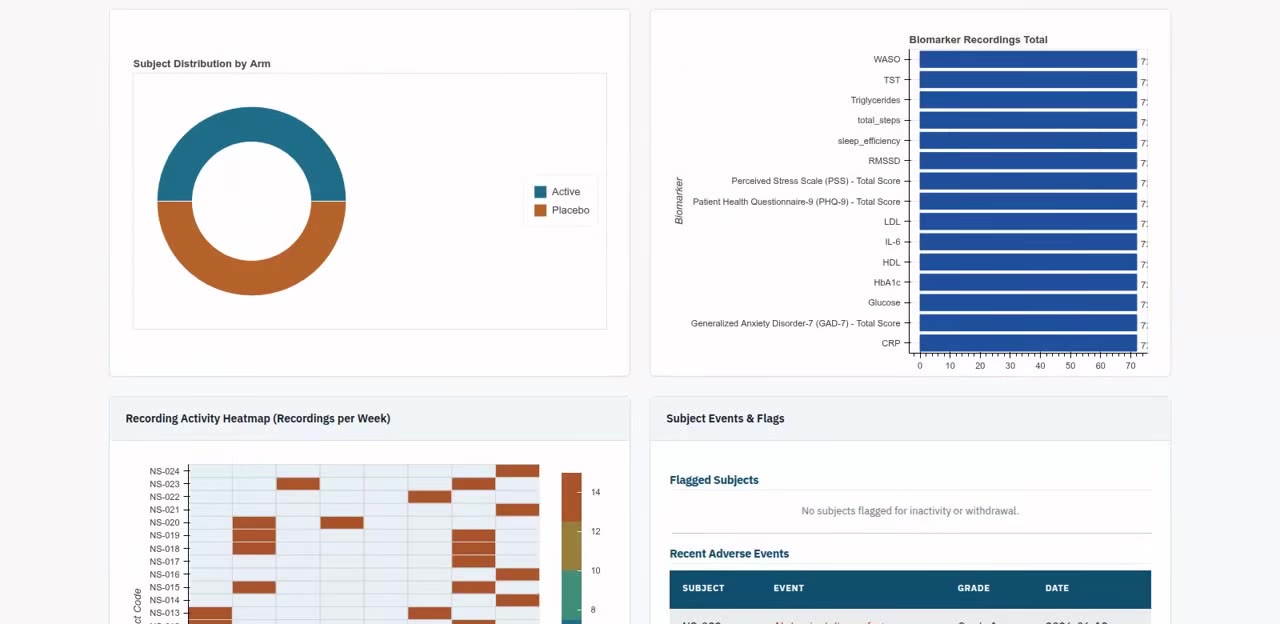
STUDYPRO study dashboard showing cohort distribution, recording totals and a per subject activity heatmap

Study dashboard: allocation, recording totals, weekly compliance and open adverse events
Wearable Signal Analysis

Wearable Workbench

Browser based analysis for research grade and consumer wearables. Drop in the archive the device portal produced and every device lands in the same Universal Wearable Format (UWF), so an Empatica session and a Garmin export are analyzed the same way and compared on the same axes. Twenty three devices are supported today, and the format is what makes the comparison possible, whether between two devices on the same wrist, between one participant and a published band, or across a whole cohort.

  • Empatica E4 and EmbracePlus, Oura, Garmin, Wahoo, COROS, Suunto, Fitbit, Apple Health, Withings, ActiGraph, Axivity, GENEActiv, Actiwatch, movisens, Shimmer3, Dexcom, FreeStyle Libre and more
  • Every signal on one clock, with zoom, pan and experiment labels overlaid on each trace
  • HRV in the time domain, the frequency domain and nonlinear: SDNN, RMSSD, pNN50, LF/HF, Poincaré SD1 and SD2, sample entropy, with ectopic beats corrected once and the correction count reported
  • EDA split into tonic level and phasic responses, with response count, rate, amplitude and area under the curve
  • Wear time found and excluded before anything is measured: van Hees on three accelerometer axes, Choi on activity counts, and a plain refusal where the recording carries neither. The rule, the channels and the reference are named
  • Sleep and circadian rhythm: the device's own staging where a recording carries it, Cole-Kripke where it carries counts, refused where it carries only raw acceleration, plus interdaily stability, intradaily variability, L5, M10 and relative amplitude
  • Comparison against published bands for sleep duration by age, steps per day and BMI, each with its citation. No z-score is computed from anything we ship; supply your own normative table as a CSV and the citation is required
  • Device agreement between two devices worn over the same window: Bland-Altman bias and limits of agreement with intervals, and a Passing-Bablok slope and intercept
  • Condition contrasts between labeled intervals, with Hedges' g and its interval. One observation is one labeled interval, never one epoch
  • A recipe of preprocessing steps that can be undone, saved and replayed across a batch of recordings, one analytics table each, a cohort view standardized within the cohort, and a session file that restores sources, participant, recipe, labels and marks exactly
Watch the demo Download the user guide User guide, PDF, 38 pages, 7 MB
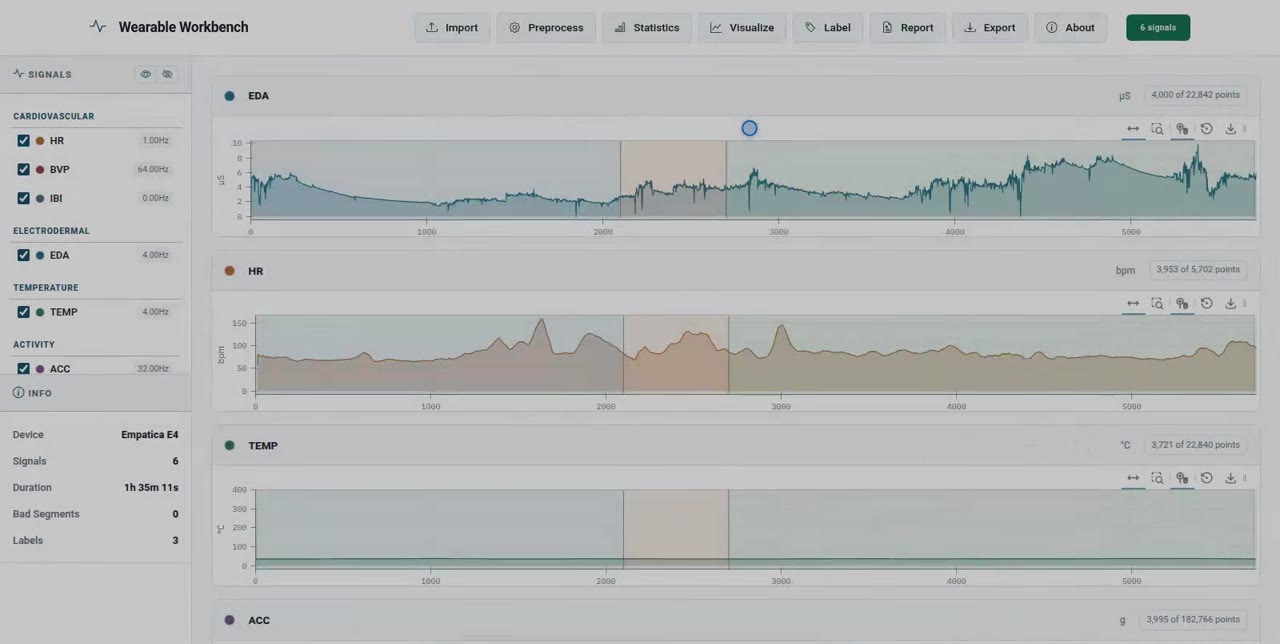
Wearable Workbench showing electrodermal activity, heart rate and temperature on a shared time axis with three experiment labels overlaid

An Empatica E4 session: six signals on one clock, with baseline, stress and relax labels overlaid on every chart

Electroencephalography

EEG Workbench

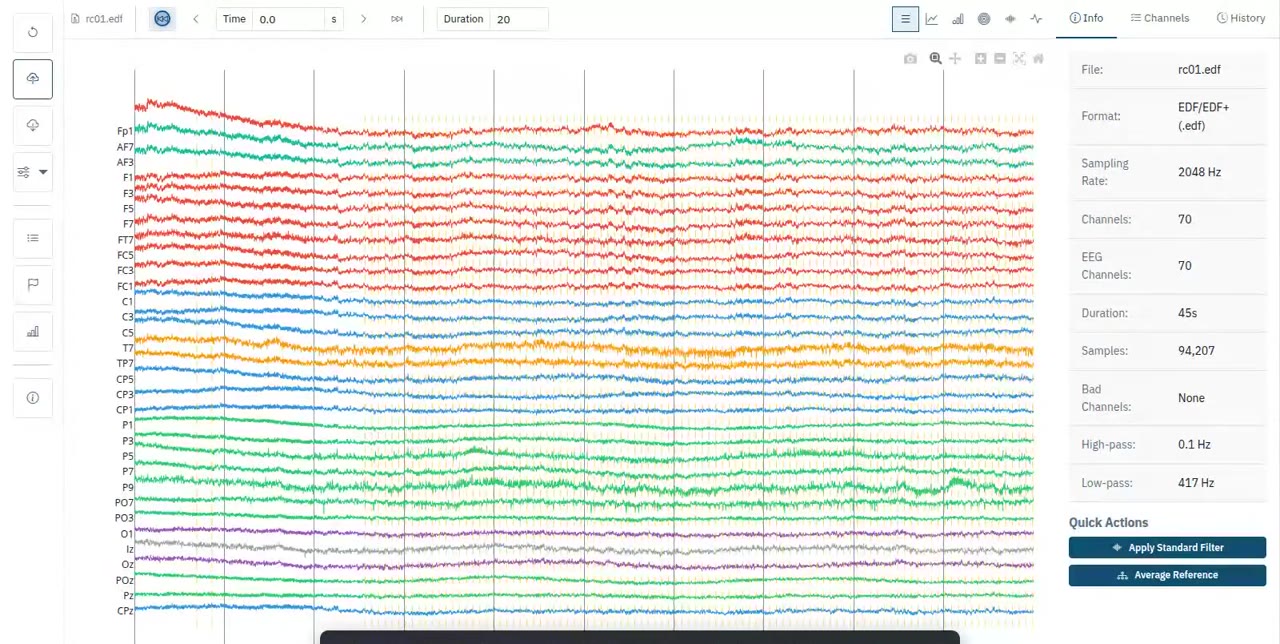
A full EEG analysis environment in the browser, from the raw file the amplifier wrote through to event related results, microstates and connectivity. It reads EDF, BDF, FIF, BrainVision and EEGLAB, imports and exports BIDS datasets, takes the format from the file rather than asking you for it, and gives you the recording itself rather than a summary of it. Every step is a recipe step, so what you did to one recording replays across the rest.

  • Seventy channels on one time base, decimated for the browser, with a window from five seconds to a minute anywhere in the recording
  • Data quality before analysis: PyPREP style bad channel detection, an epoch quality dashboard, and a report that tells a wrong amplitude scale apart from dead electrodes
  • Filtering, line noise removal by notch or spectrum fit, re-referencing and the surface Laplacian, with a filter response preview and each step listed as it completes
  • Channels renamed and a montage applied afterwards, reporting how many electrodes actually took a position rather than reporting success having positioned none
  • ICA with components matched automatically to EOG and ECG
  • Power spectral density and band power with topographies at any instant, per band or every band at once, and 1/f separation of the aperiodic background from true oscillations
  • Time frequency as a spectrogram or through Morlet wavelets, with ERSP and inter trial coherence once the recording has epochs
  • Epoching around markers with baseline correction, ERP waveforms with confidence bands, named components, butterfly plots, single trial ERP images and condition contrasts
  • Microstates with a transition matrix, connectivity between channels, and a normative comparison you supply the norms for. The workbench ships none
  • A recipe replayed across a batch, sessions saved and restored, a PDF report, publication resolution figures, and export as FIF, EDF, BrainVision, EEGLAB, BIDS or CSV per epoch
Watch the demo Download the user guide User guide, PDF, 81 pages, 28 MB
EEG Workbench showing thirty two channels of a clinical EDF recording on a shared time base

A clinical EDF at 2048 Hz: thirty two channels on one time base, with everything the file declares about itself alongside

Biomarker Discovery

Analytics Workbench

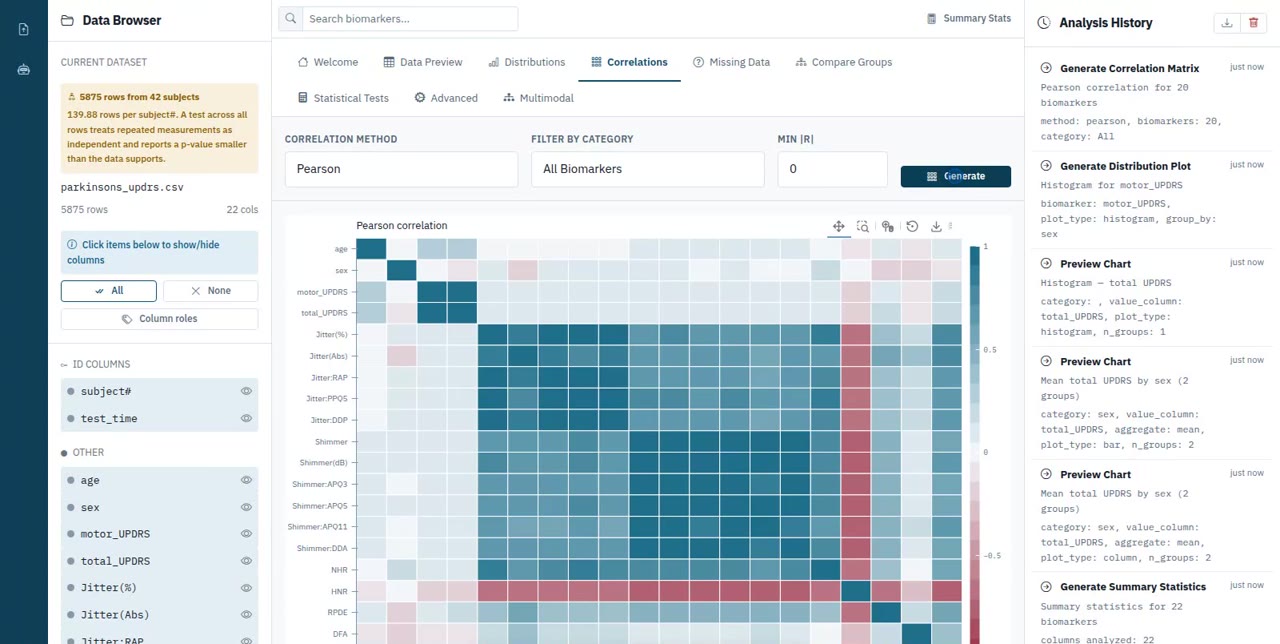
Statistical discovery for mulltipe industries and problem domains. Import a CSV and the profiler infers what every column is, then takes you from summary statistics and correlations through the right test to models, forecasts and a recorded methods section.

  • Import that profiles every column and repairs what it reads, naming every repair, role inference for identifiers, time, covariates and measurements, all of it visible and overridable, with a missing data report and imputation
  • Distributions, correlations with intervals, outlier scans that report a clean result as a result, and cross tabulation with Fisher exact and standardized residuals
  • Group comparison with the test the data demands, Welch by default, and an effect size with an interval beside every result
  • Repeated measures detected and flagged before a p value is reported, within subject tests and random slopes, and batch screening across a whole panel with FDR or Bonferroni correction
  • Twelve linear models behind one selector, with feature selection scored inside every fold rather than once beforehand
  • A learner leaderboard with nested cross validation for tuning, per class recall reported rather than accuracy alone, per prediction explainability, and a fitted model scored against a new file
  • Forecasting backtested on rolling origins against a naive baseline, survival curves with log rank and Cox, and anomaly detection with no trained model anywhere in it
  • Calibration with limits of detection and quantitation, principal components, factor analysis, and a cross domain biomarker network
  • Optimize: a search of the factor space for the settings that best meet a stated objective, showing the trade offs rather than a single answer
  • A Methods section written from the recorded analysis and nothing else, so a step that was never run cannot appear in it
Watch the demo Download the user guide User guide, PDF, 103 pages, 27 MB
Analytics Workbench showing a regression coefficient table with 95% intervals and plain-English readings

Every estimate with its 95% interval, and a plain sentence saying what each one means

Medical & Research Imaging

Imaging Workbench

Import a scan in DICOM, NIfTI or a plain research image and work on it with the same rigor as the other three workbenches: every preprocessing step recorded, every AI result reviewable, nothing ever modified in place. Twelve AI models cover MRI, CT, X-ray and microscopy.

  • DICOM, NIfTI and plain research images (X-ray, microscopy), with de-identification and automatic quality control on every series, including a check that a scan's own axis order matches what the viewer's plane labels assume
  • Twelve sample AI models covering segmentation, detection and classification across MRI, CT, X-ray and microscopy
  • Five manual segmentation tools, threshold, region growing, rectangle, polygon, freehand brush, reviewed the same way as an AI result: accept, reject, or override
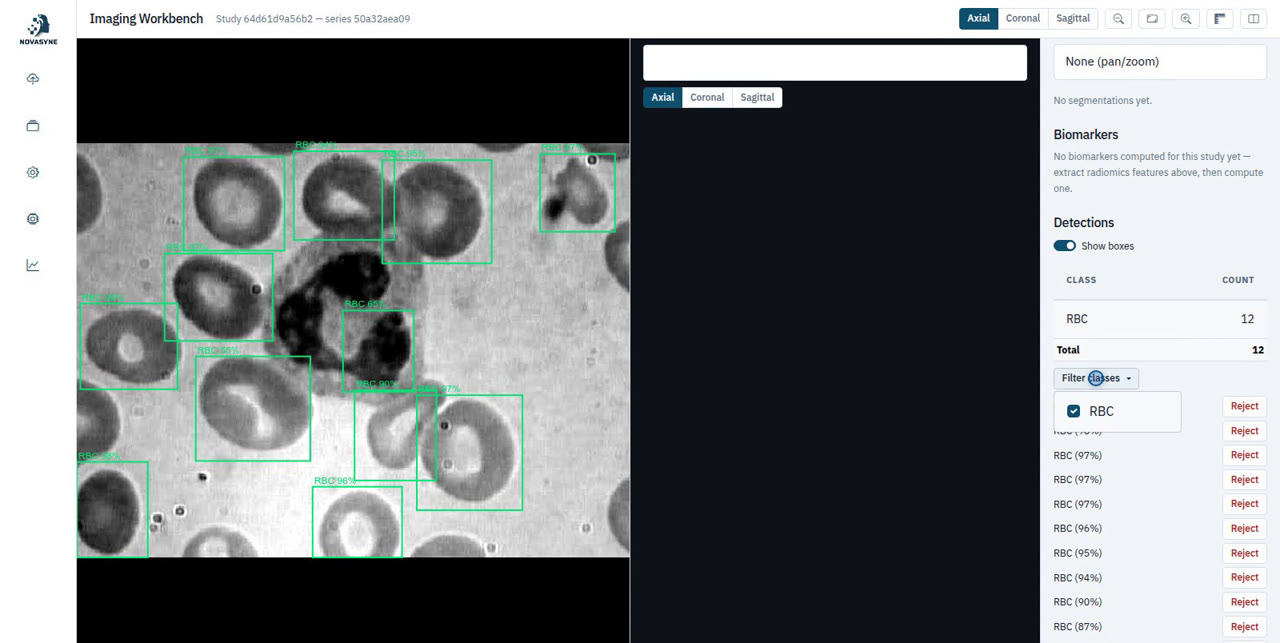
  • Detections counted automatically by class with a checkbox filter, so a field of dozens of cells is never counted by hand
  • Radiomics feature extraction and named, versioned biomarkers, tracked and exported
  • A full preprocessing pipeline, bias correction, denoising, resampling, canonical reorientation, and rigid or affine registration between series, each producing a new derived series rather than altering the original
  • Longitudinal tracking across repeated visits, with a measured volume trajectory and export to Analytics Workbench or STUDYPRO
Watch the demo Download the user guide User guide, PDF, 48 pages, 11 MB
Imaging Workbench blood cell detection with a per-class count panel and filter, twelve red cells found and boxed

Every detection counted automatically, by class, with a filter to isolate one on the image itself

Literature Review & Meta-Analysis

Research Workbench

The first tool in the Novasyne chain, turning an unstructured research question into a structured, evidence-backed foundation before a study ever begins. Import your own library, or find papers directly on arXiv, PubMed, Europe PMC and Crossref, and Research Workbench builds claims and evidence you can trust: every claim traced to the passage and page it came from, a literature review and meta-analysis assembled from that evidence and nothing else, and a research foundation whose citations are all real. What it hands forward can start a study in STUDYPRO or a dataset in Analytics Workbench.

  • PDF import with automatic document categorization, and Find Papers search across arXiv, PubMed, Europe PMC and Crossref with one-click fetch of the open-access text
  • Keyword and meaning-based search across the whole library, every passage traceable to the page and character range it came from
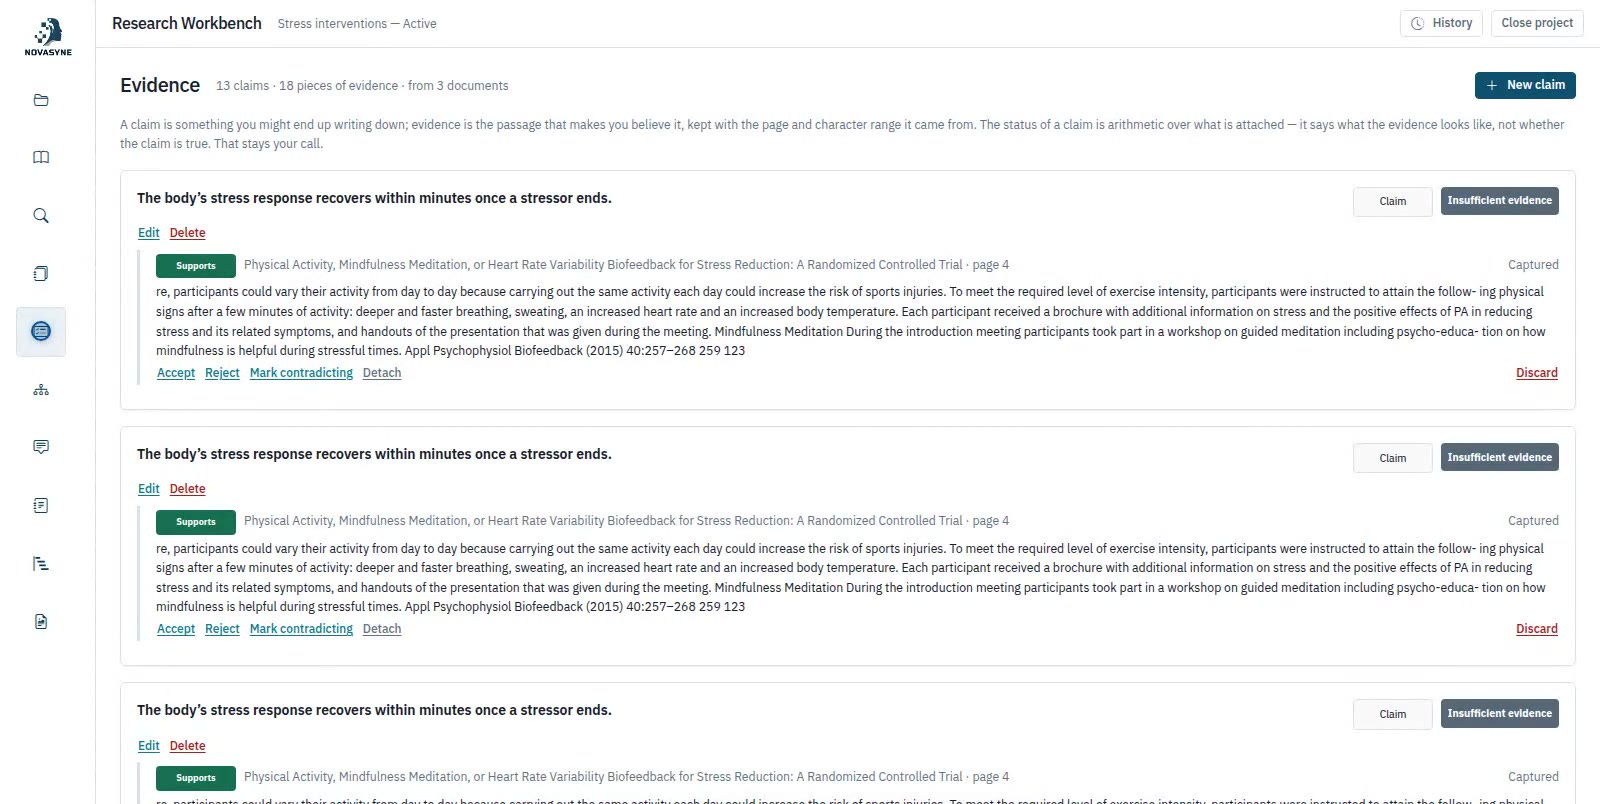
  • Claims and evidence held apart: a claim's status is arithmetic over what evidence supports, contradicts or is missing, never a guess
  • A research graph laying out papers, evidence and claims as one navigable network, recentring on whatever node you inspect next
  • A field landscape mapping where the evidence in a project actually sits, and where it runs thin
  • A research assistant answering six kinds of question over your own library only, every answer grounded in cited passages, with an unanswerable question refused rather than guessed at
  • Study profiles extracted per document, population, design, method, measure, outcome and limitation, every field cited or left honestly blank
  • A literature review assembled from the project's own claims and evidence, section by section, with an uncited sentence deleted before you ever see it
  • Meta-analysis with pooled effects, heterogeneity and publication-bias diagnostics, refusing to pool outcomes that are not comparable
  • A research foundation, an introduction and related work section with every citation real, exported to Markdown, LaTeX, Word or as a JSON hand-off to the next workbench
Watch the demo Download the user guide User guide, PDF, 64 pages, 17 MB
Research Workbench evidence pane showing claims linked to the passages that support or contradict them, each traced to a page

A claim's status is arithmetic over its evidence, never a guess: thirteen claims built from eighteen pieces of evidence across three documents

Analytics Workbench by sector

The same Analytics Workbench, multiple industries

Eight public datasets, one per sector, each taken from import to results in about four minutes.

6

Products

23

Wearable Devices Supported

5

EEG Formats Read And Written

36

Projects & Research Publications